

LifeClock (Part 1/2): From Memento Mori to Python#
Tim Urban’s life-in-weeks illustration puts a long span of time into one small grid. In his article “Your Life in Weeks,” Tim Urban presents a starkly powerful image: a grid of tiny boxes, one for each week of a 90-year life. Staring at this grid, you realize that your life isn’t an abstract, endless expanse. It’s finite, fully countable, and surprisingly short when visualized this way.
This single image inspired me to turn a profound philosophical concept into a tangible, personal artifact for my CS50 Python final project. The result is “LifeClock,” a command-line tool that generates a personalized “Your Life in Weeks” poster. This post will walk through the most impactful takeaways from building it, from ancient philosophy to modern Python. The technical choices also shaped how I wanted the poster to invite reflection.
LifeClock series: This is Part 1/2. Next up: LifeClock (Part 2/2): Refactoring to Clean Architecture.
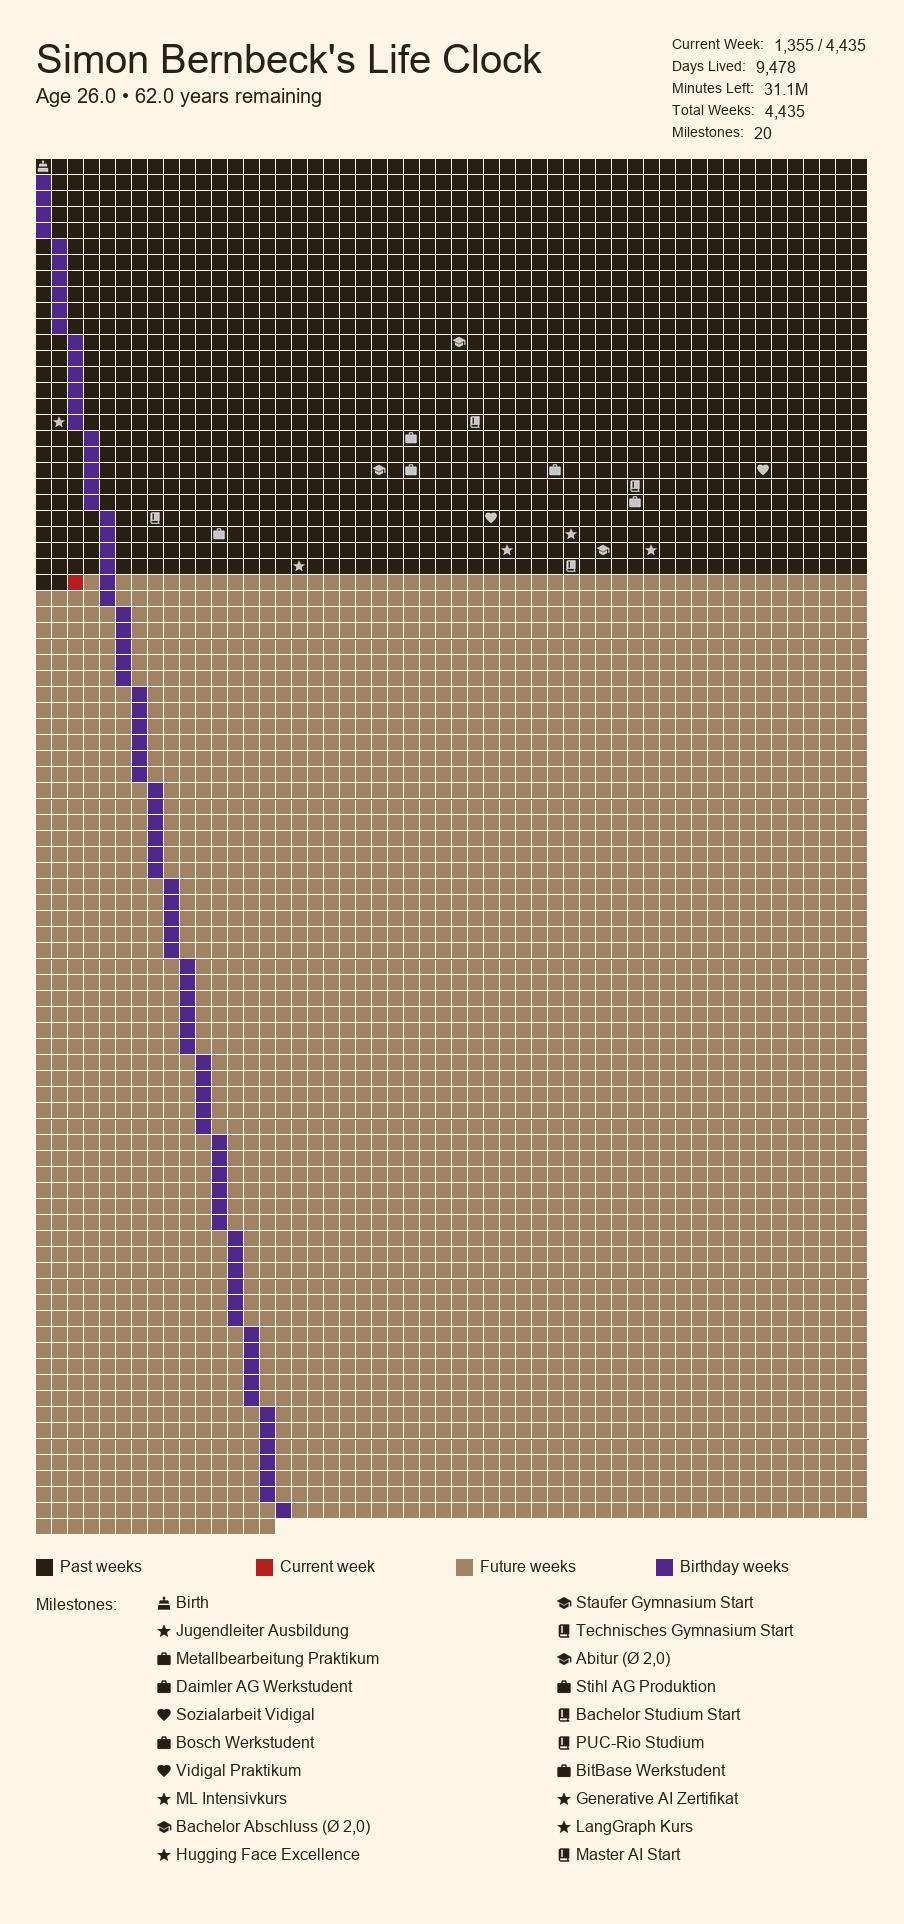
Each square = one week. Dark brown = past, red = current, tan = future, purple = birthdays.
The Spark: An Idea Worth Coding#
The inspiration for LifeClock was twofold. First was the concept from Tim Urban’s article, which describes our weeks as a “tiny handful” of “precious” gems that are “fully countable.” When you compress a 90-year life into a single image, the weeks become tangible—roughly the volume of a tablespoon of diamonds. Suddenly, the question “Are you making the most of your weeks?” hits differently.
Second, this modern visual tool connects directly to the ancient Stoic practice of Memento Mori, a Latin phrase meaning “remember you will die.” The practice is not meant to be depressing. Instead, it is a tool to create priority, meaning, and urgency, encouraging us to treat our time as a gift and not waste it on the trivial. The Stoic idea of memento mori gave the visualization a second meaning for me: a prompt to consider how I spend time.
The project became an exercise in using code to create a modern vanitas—a symbolic work of art that serves as a personal reminder of life’s fleeting nature.
The Blueprint: Structuring Philosophy into Functions#
Translating a philosophical idea into a logical code structure was the first technical challenge. Just as Stoicism asks us to separate what we can control from what we can’t, good software design asks us to separate a program’s responsibilities. To keep the project clean and manageable, I adopted a two-file functional architecture based on the principle of Separation of Concerns. The logic for user interaction lives in helpers.py, distinct from the unchangeable mathematics of a lifetime in project.py.
The two files are:
lifeclock/
├── project.py        # Core logic: compute_expectancy, life_stats, render_weeks_poster
├── helpers.py        # User interaction and validation utilities
├── test_project.py   # 25 comprehensive tests (100% coverage)
└── requirements.txt  # pillow, pytest
The core functions handle distinct responsibilities:
compute_expectancy(): Calculates life expectancy based on lifestyle factorslife_stats(): Determines where you are on the timelinerender_weeks_poster(): Transforms data into visual art
This separation wasn’t just about files; it extended to the functions themselves. Using features like keyword-only arguments made the code self-documenting and less prone to errors, reinforcing the goal of creating a clear and robust tool for reflection.
The Engine: The Mathematics of a Lifetime#
The heart of the LifeClock application is the compute_expectancy() function. This is where abstract lifestyle choices are quantified and translated into a concrete number: your estimated life expectancy in years. The algorithm begins with a baseline expectancy and then applies a series of deltas, or adjustments, based on four key lifestyle factors.
The program applies these illustrative adjustments:
- Activity: High activity adds 2.0 years, while a low activity level subtracts 2.0 years
- Smoking: A heavy smoking habit subtracts a significant 8.0 years
- Sleep: Getting less than 6 hours of sleep subtracts 1.0 year, while optimal sleep (6-9 hours) adds a modest half-year
- BMI: A healthy BMI (18.5-25) adds 0.5 years, while an obese one (≥30) subtracts 3.0 years
After all deltas are applied, the final calculated expectancy is clamped to a range between 40 and 120 years. This ensures the final output remains within a realistic human lifespan.
# Simplified example of lifestyle adjustments
delta = 0.0
if activity == "high": delta += 2.0
if smoking == "heavy": delta -= 8.0
if sleep_hours < 6: delta -= 1.0
# ... (BMI calculations)
adjusted = baseline + delta
return max(40, min(120, adjusted))  # Clamp to realistic range
These numbers are design choices for a reflective poster, not a validated prediction of anyone’s lifespan. The output should not be read as health advice.
The Surprise: The Counter-intuitive Drift of a Birthday#
One of the most surprising discoveries during development was a visual quirk in the final poster: the purple squares marking birthdays do not fall in the same week-column every year. Instead, they drift diagonally across the grid over time, creating a subtle “staircase” pattern.
The reason for this “drift” is simple mathematics:
- A regular year has 365 days, which is exactly 52 weeks plus 1 extra day
- A leap year has 366 days, which is 52 weeks plus 2 extra days
These extra days accumulate year after year. Approximately every 5-6 years, the accumulated offsets add up to a full week, causing the birthday square to shift over to the next column. This creates a visible “staircase” pattern on the poster. This required a specific helper function, safe_birthday(), to handle the logic of mapping a February 29th birthday to February 28th in non-leap years—a perfect example of a philosophical observation creating a concrete coding challenge.
Bringing It to Life: Visual Implementation#
The poster generation uses Python’s Pillow (PIL) library to transform calculated data into visual art. The grid layout is carefully designed:
- 52 columns representing weeks per year
- 16×16 pixel cells for clarity without overwhelming detail
- Color-coded squares: Dark brown for past weeks, bright red for your current week, light tan for future weeks, and purple highlighting birthdays throughout your timeline
- Right-aligned statistics panel showing your life metrics at a glance
The rendering logic iterates through each week of your calculated lifespan, assigning colors based on whether that week is in your past, present, or future. Birthday weeks get special purple highlighting.
# Color each week based on time position
for week_index in range(total_weeks):
    if week_index in birthday_weeks:
        color = purple
    elif week_index < current_week:
        color = dark_brown
    elif week_index == current_week:
        color = red
    else:
        color = tan
    draw.rectangle([x0, y0, x1, y1], fill=color)
The rendering logic includes smart fallbacks—it tries to use your system’s Arial font but gracefully falls back to Pillow defaults for cross-platform compatibility. The result is a personalized PNG poster that serves as both data visualization and philosophical artifact.
The Proof: Building with Confidence via Testing#
A key requirement of the CS50 project was to write tests for our code, and this proved to be one of the most valuable parts of the development process. The project includes a comprehensive test suite in test_project.py with a total of 25 tests. These tests cover the core functions in project.py, checking the behaviours covered by those tests. They verify:
- Calculation Accuracy: Confirming the life expectancy deltas and life statistics are computed correctly
- Boundary Conditions: Checking that the clamping mechanism for life expectancy works at its minimum (40) and maximum (120) limits
- Edge Cases: Testing tricky edge cases, like ensuring a person born on February 29th still has their birthday correctly plotted in common years, to prevent the logic from failing on uncommon inputs
Using the pytest framework to implement a Test-Driven Development (TDD) approach provided immense confidence. Coverage helped me refactor, but it cannot prove that the illustrative expectancy model is medically sound or catch every regression.
The CS50 Journey#
This project was built for Harvard’s CS50 Introduction to Programming with Python, an intensive course that teaches programming fundamentals through practical projects. The final project requirements demanded originality, comprehensive testing, and a video demonstration explaining the implementation.
LifeClock gave me a concrete way to connect a programming exercise with a question about how I use my time.
See It in Action#
Watch the full demonstration of LifeClock in action, from command-line prompts to final poster generation:
The video walks through the interactive prompts, lifestyle factor calculations, and the surprising moment when your life appears as a grid of colored squares—each one representing a week you’ve lived or have yet to experience.
Explore the Project Yourself#
For those who want to dive deeper into the code or run the application themselves, here are the project resources:
- GitHub Repository: Sims2k/LifeClock
- Video Demo: YouTube
- Required Libraries: To run the project, you will need
pillowfor image generation andpytestfor running the test suite
To run the project:
cd lifeclock
pip install -r requirements.txt
python project.py
The tool will guide you through a series of prompts about your birthdate and lifestyle factors, then generate your personalized poster.
Additional Resources:
- Tim Urban’s “Your Life in Weeks” (Wait But Why)
- Marcus Aurelius’ Meditations (free audiobook from Daily Stoic)
Your Turn to Fill the Weeks#
This project was a journey from the profound ideas of Tim Urban and ancient Stoic philosophers to a functional Python application. It demonstrates how coding can be a powerful medium for exploring and interacting with abstract concepts about our own lives. I use the resulting poster as a prompt for reflection.
The grid does not tell me how long I will live. It simply makes the passage of weeks visible, which was enough to make the programming exercise feel personal.
This article is part of my Digital Odyssey series, where I document technical projects that bridge philosophy, productivity, and personal growth. LifeClock was my CS50 Python final project, developed as a CS50 Python final project.